|
In mathematics, grade 7's have been busy, using percentage to verify how close their central tendency calculations could get to the real wall lengths. Central tendency calculations were compared to actual blueprint measurements for our classroom and a few others in the school. One student stated, he was shocked to see how his median calculation could be 98% accurate when his range of data was 8 meters. Many students witness first hand how the median could be "outlier resistant" and was the best choice to represent their classroom measurement data. This work started out with one simple outcome, to determine the area and perimeter of a room, and quickly became an authentic space to use data analysis. Student reflections of the classroom measurement inquiry can be found on FreshGrade. In Science, students explored bridges on the Bow River noting joining technology, material usage, and the types of bridges they explored. Students took inspiration from these structures for their bridge design challenge.
0 Comments
Shape and space is being supported by the study of statistical analysis in grade 7. Four walls and the height of two classrooms were taken. Students are continuing to analysis the data collected by both the grade 7 and 8 classes, supported by the spreadsheet application, Numbers. Grade 7's graphed the measurements of the height and length of each wall from the previous collected data. Can we find one value to represent the lengths of each walls from the data ? Will students use the mean, median, or mode? They will decide. Below is one example of the measurements taken for the back wall of room 27. 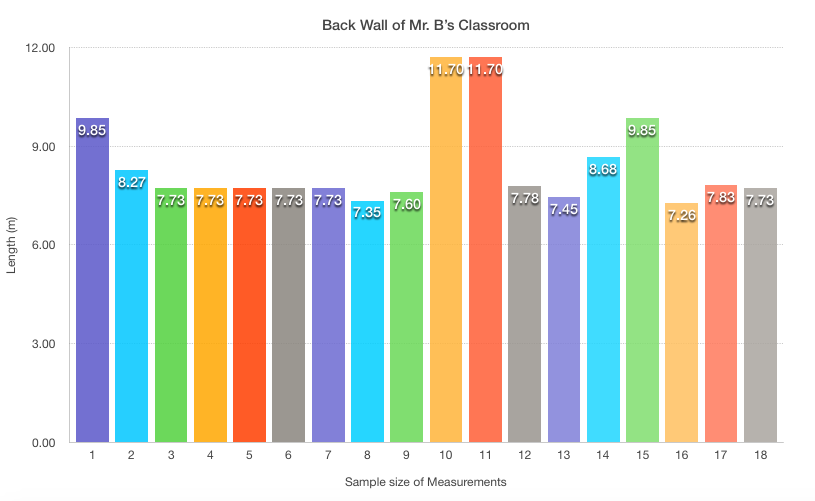 Students have been researching interesting structures around the world to explore how external and internal forces have framed the engineering of the structures they can chosen. From the Peace Bridge and BowTower, here in Calgary, to buildings in Taiwan. Students are taking their learning in Structures and Forces and applying it to their research about their interesting structures.
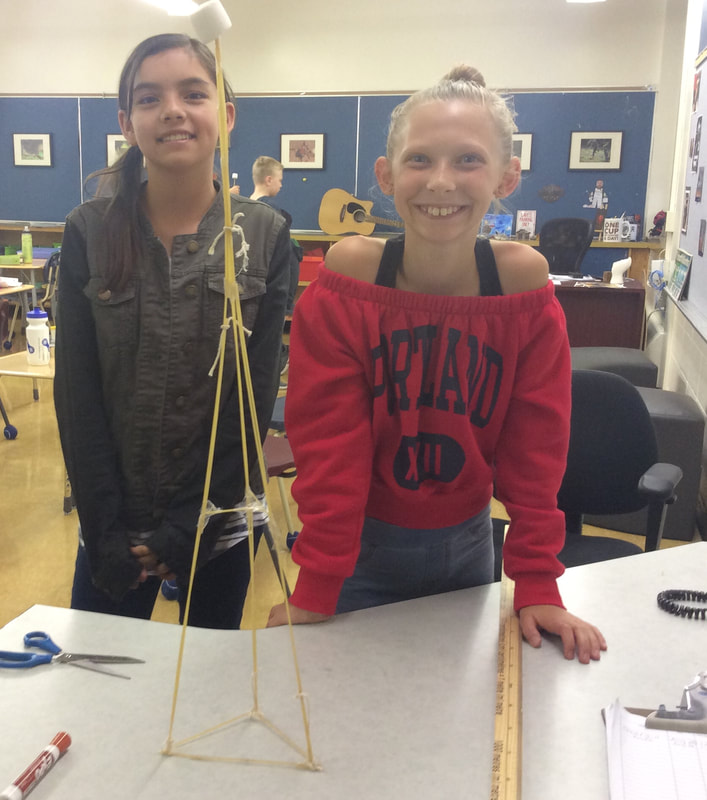
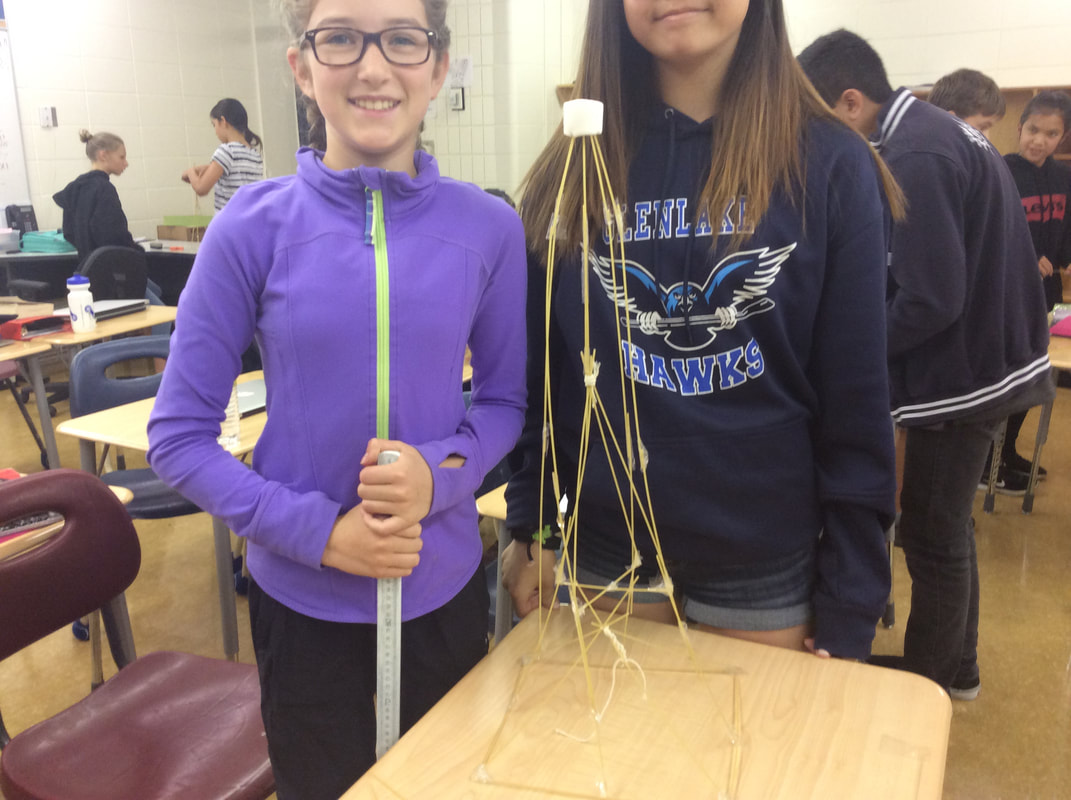
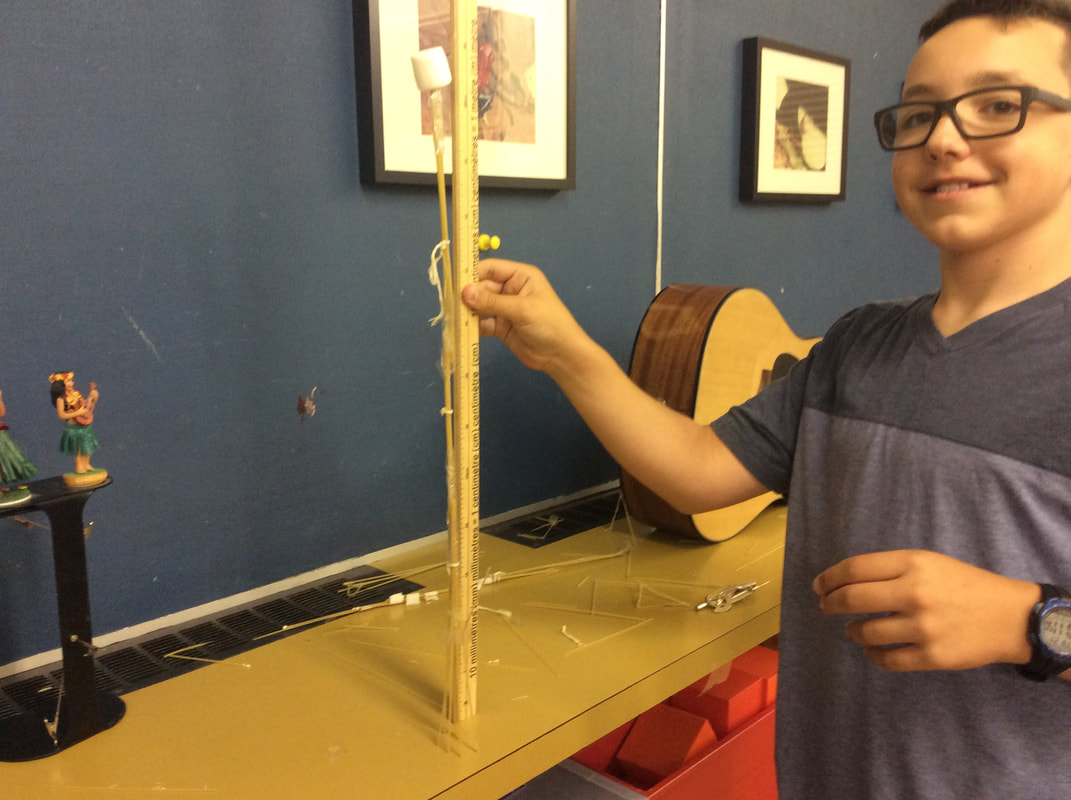
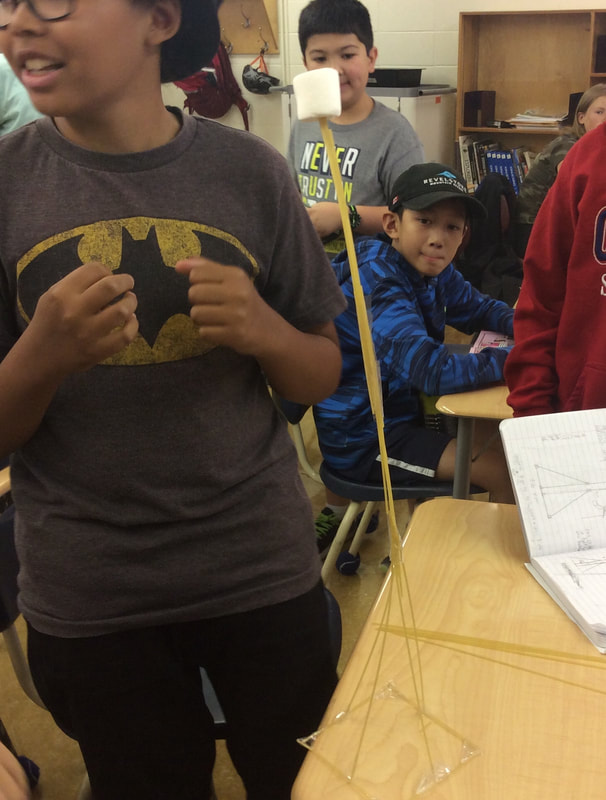
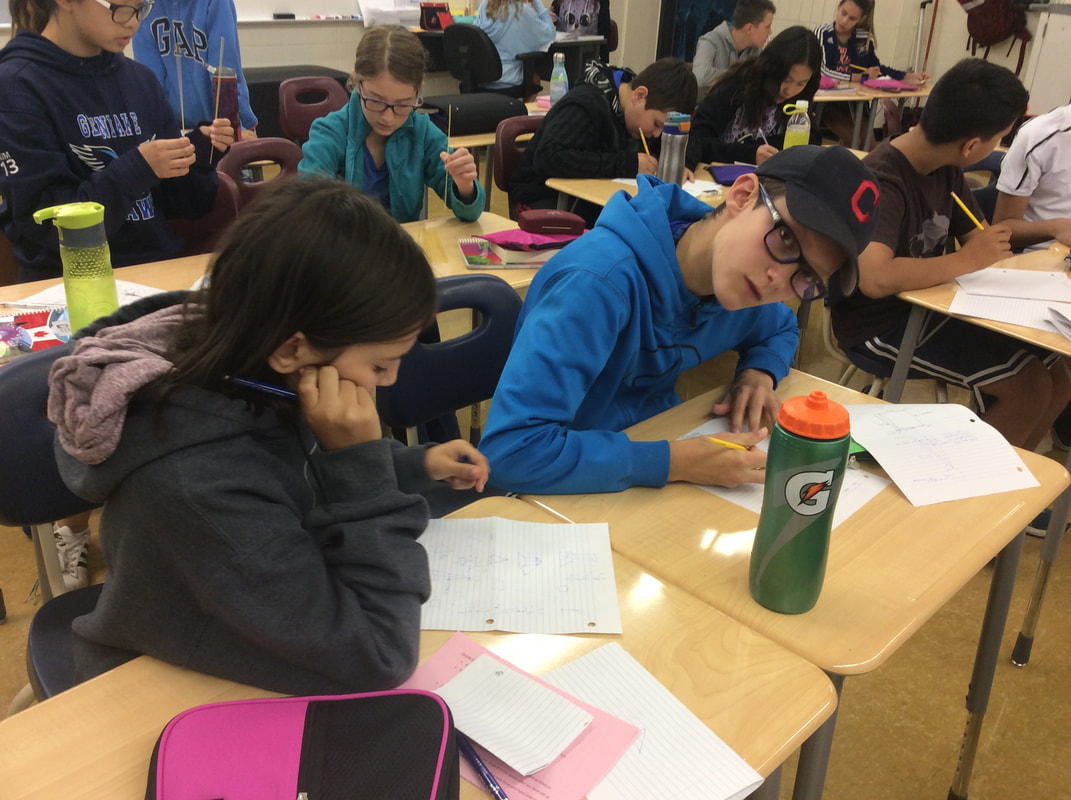
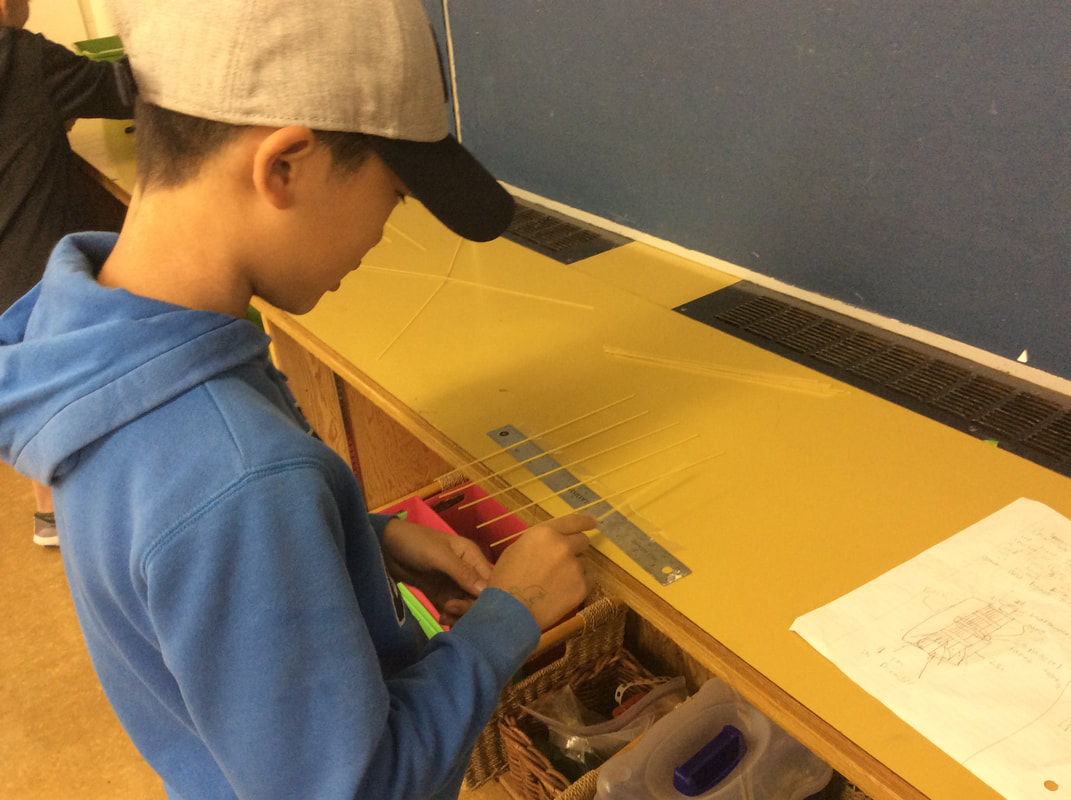
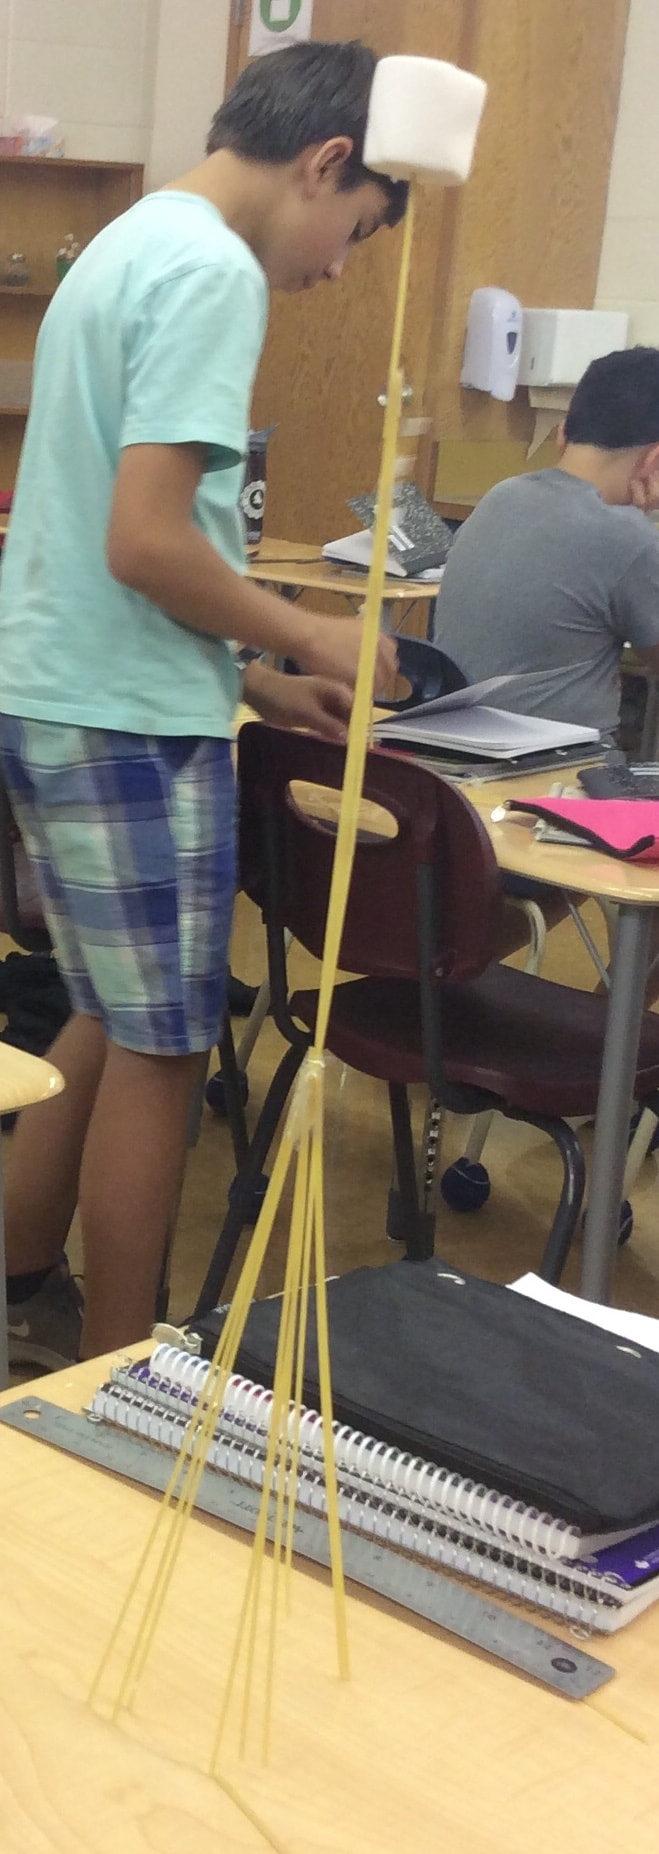
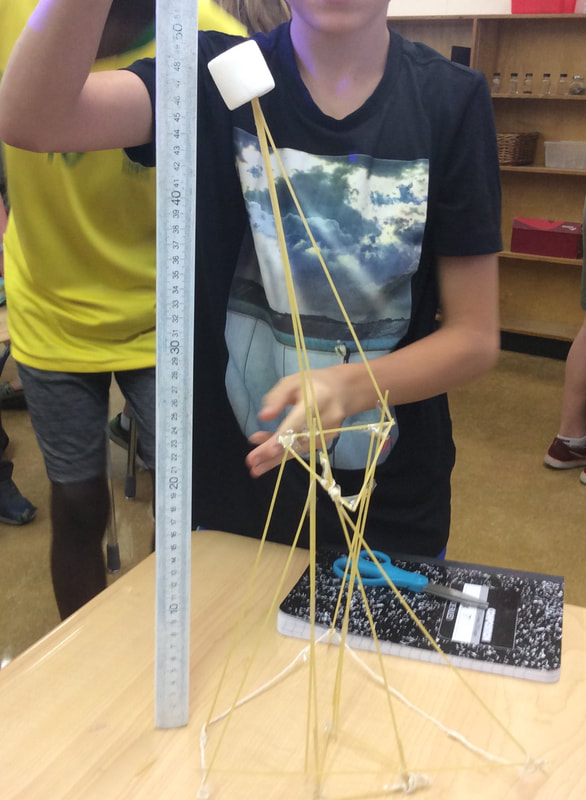
In mathematics, we are continuing to work in shape and space with the measurements we took with the grade eights. Using a Google Doc, students were able to see all the measurements taken for the different walls in our school's classrooms. It quickly became evident there was quite a range in the data. Our next steps are regarding how we can use statistical analysis to get our measurements closer to the blueprints of the school. Application of the concepts we are learning in statistics will be used in meaningful ways to see if we can get our data closer to the real schematics. Students are hoping to be able to create a 3D rendering of the different classrooms to compare them, using Google Sketch Up. This week the students in grade 7 and 8 worked together to measure their classrooms to see if their new spaces are larger than their previous ones. Their past knowledge of area and volume was applied as students worked together to use math to prove their conjectures. AFTER SUBMITTING THEIR PLANS, STUDENTS WERE GIVEN MATERIALS TO BUILD THE HIGHEST FREESTANDING MARSHMALLOW TOWER. DESIGN THEORY AND COLLABORATION WERE THE THEMES OF THIS INQUIRY IN STRUCTURES AND FORCES. The students' next steps will be to reflect on how they worked with their partners and how they worked to use the design process to overcome challenges in their prototype construction.
       |
Mr. BennettThank you for visiting the Math + Science blog. Visit regularly to see what interesting work we are doing. Archives
April 2019
Categories |


 RSS Feed
